Defensive rating
Netball gets the NBA metric treatment part 3
The compliment to offensive rating is defensive rating. It’s very similar to offensive rating, but instead of counting goals and possessions accumulated for a given side, those statistics are counted for whomever was their opposition in each game. It is a measure of a given team’s opponent’s offensive efficiency. The lower the defensive rating, the better.
Defensive rating = goals against/possessions againstInterestingly, goals and possessions counted in each season are the same as those counted for offensive rating, they’re just allocated to their opponents. This means that the season averages are the same for offensive ratings.
The best defence
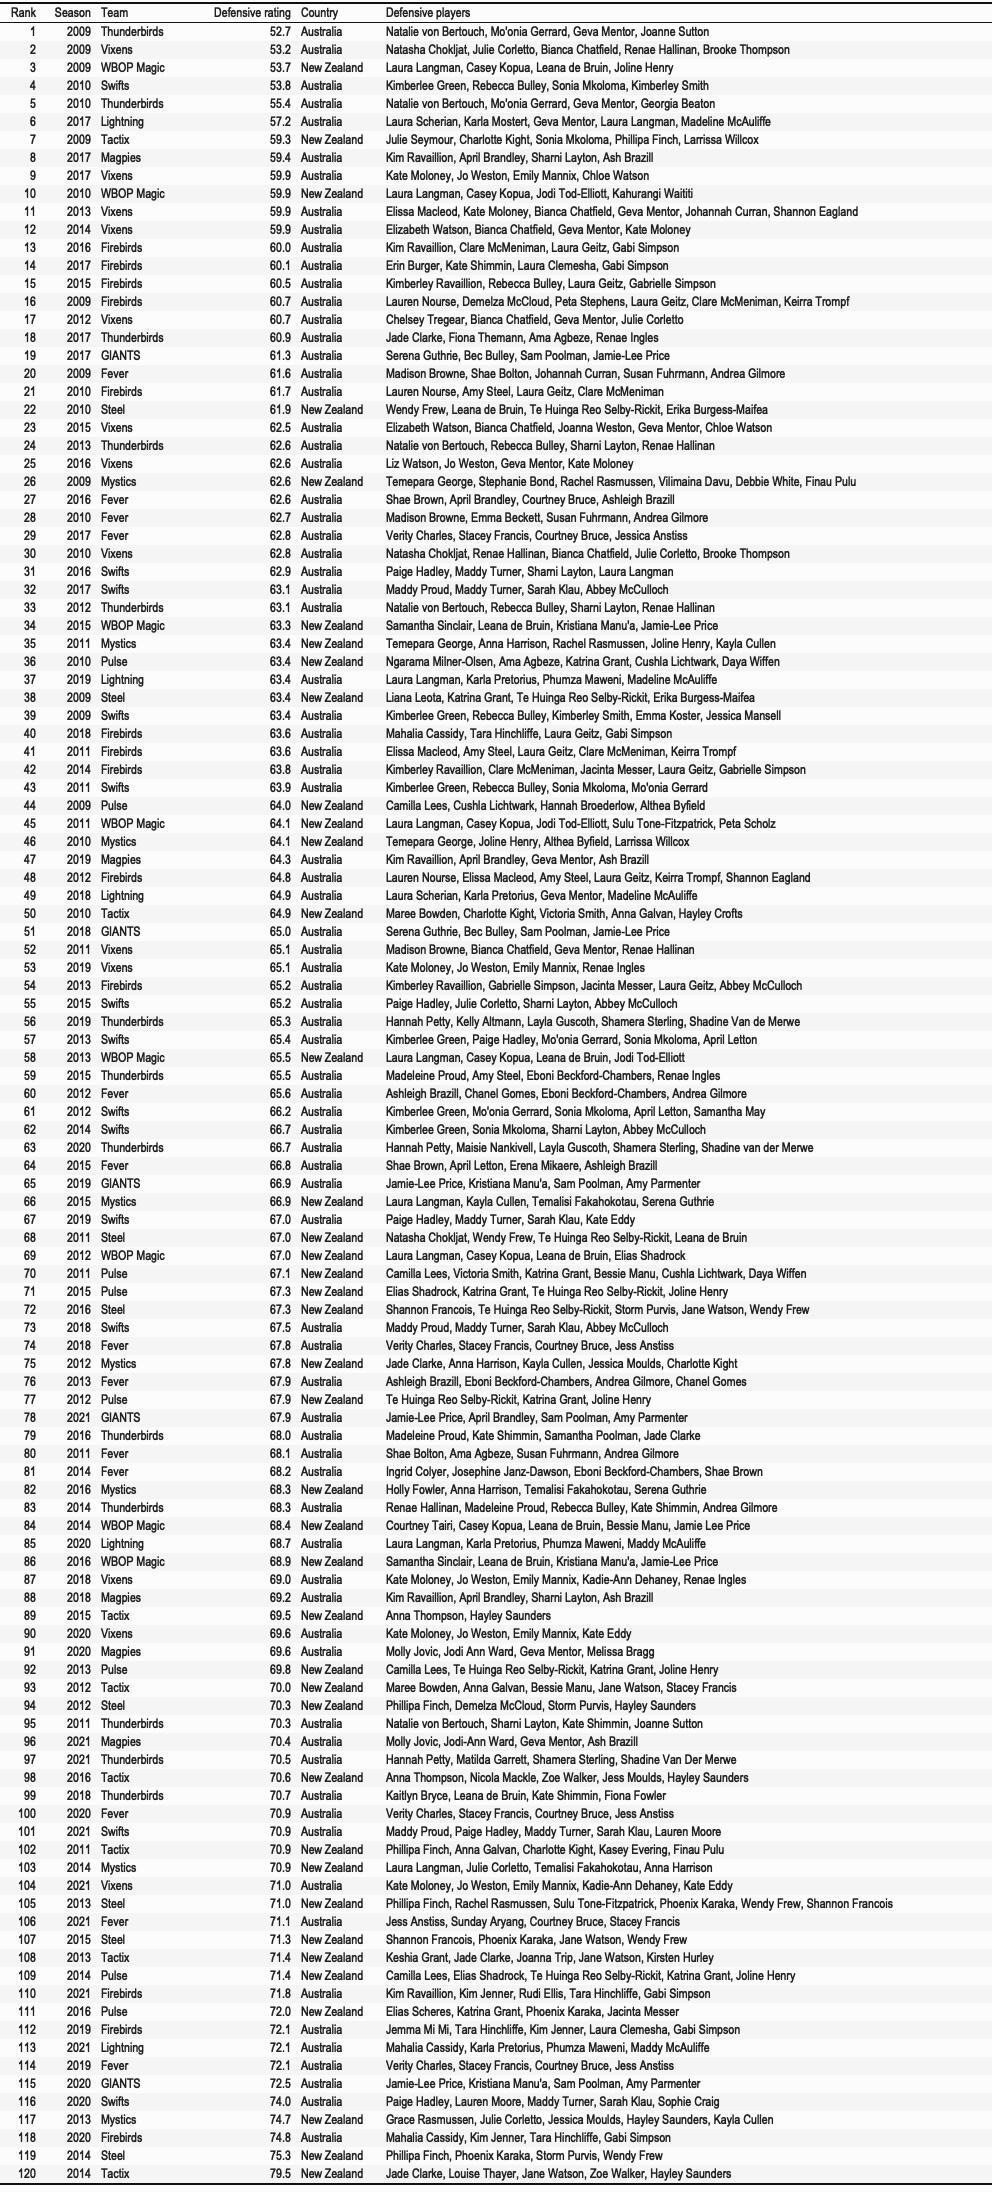
The table below shows the teams that had the lowest defensive ratings between 2009 and 2021, with data courtesy of Champion Data.
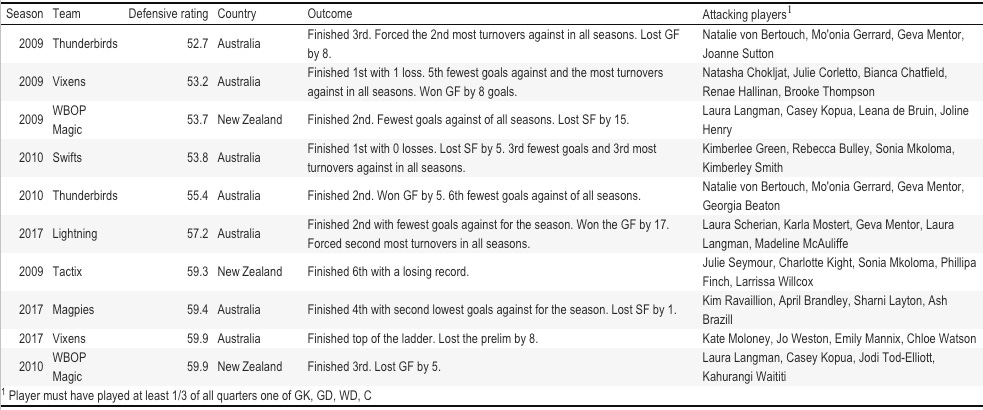
The 2009 Thunderbirds had the lowest defensive rating with 52.7, meaning around only half of their opponents possessions were converted to goals. This team lost the grand final to the second best defensive rated team, the 2009 Vixens. The third best defensive rating was the 2009 WBOP Magic, who lost the semi final the Thunderbirds. The general theme of these three teams is their defensive players had (and in one case is still having) decorated international careers.
All the lowest defensive ratings were in 2009, 2010 and 2017. As shown in the previous post on offensive ratings, these years were the worst years for offence, mostly due to a significant increase in turnovers in those years and relatively inaccurate shooting in the early years of the ANZ Championship.
The sides with the best defensive ratings tended to be the teams that played until the late rounds of the finals. 3 of the 4 teams in the top 10 from 2009 made the semi and grand final. The same is true for the teams from 2010, with the 3 teams in the top 10 making either the semi or grand final. The 2017 Lightning stormed home in the grand final to win by 17.
This is different to offensive rating, where the teams in the top 10 had less finals success. In addition to this, the teams with the best defensive rating were often from the same year had to compete against each other during the season and in the finals.
The worst
The table below shows the teams that had the highest defensive ratings between 2009 and 2021, with data courtesy of Champion Data.
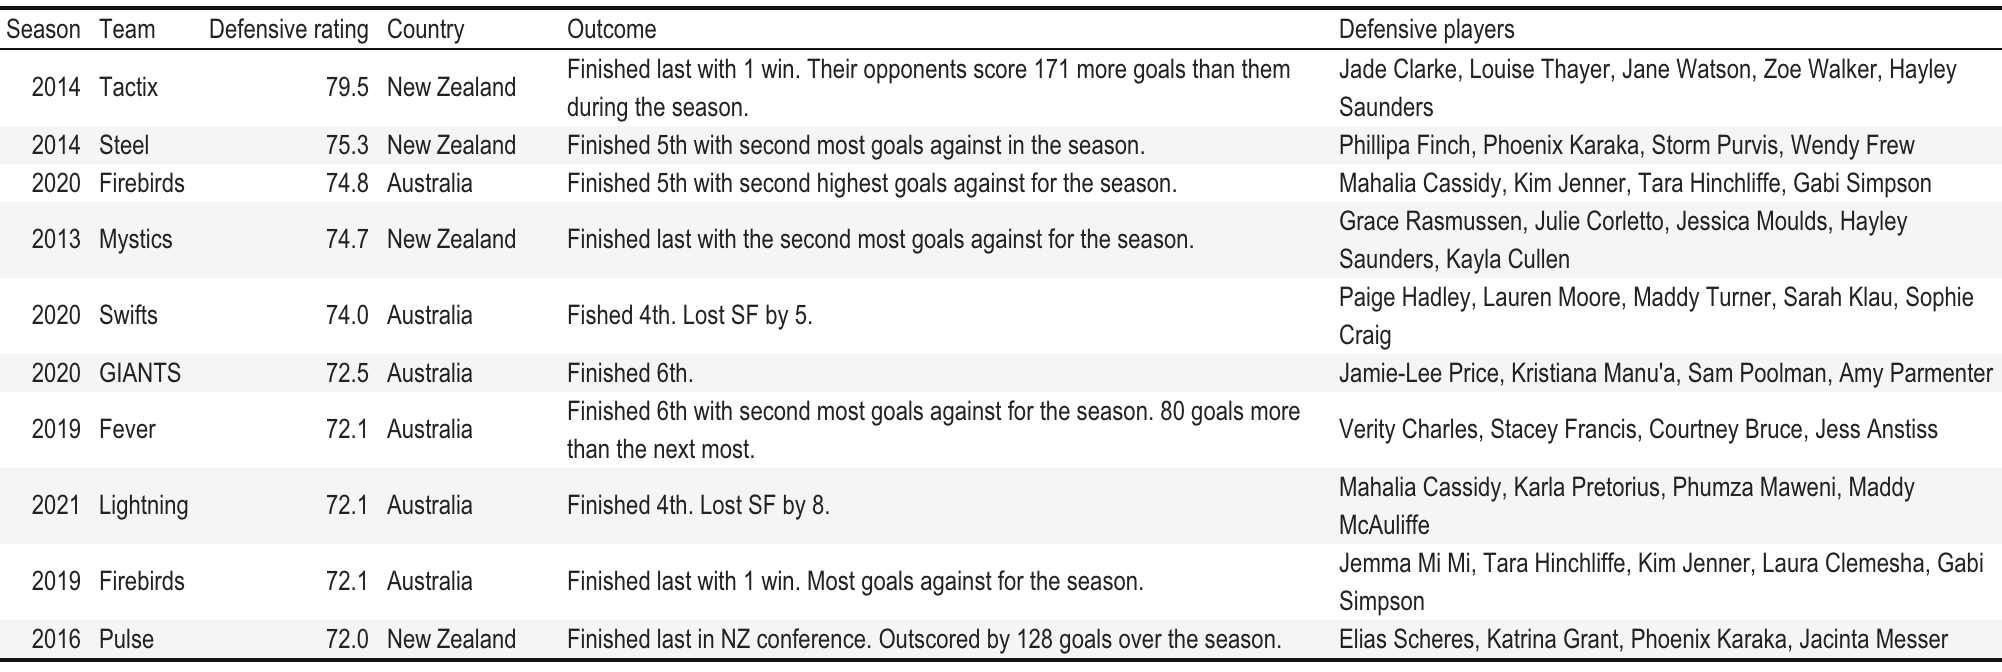
The 2014 Tactix were significantly worse than the other teams in the 12 years analysed. This team was outscored by other teams by 171 goals throughout the season, an average of 13 a game. The other teams in the list had very limited success, especially before 2020, when the super shot was introduced and has somewhat skewed the results here.
Again we see the influence of the super shot, where three teams from 2020 and one from 2021 made the top 10. The 2021 Lightning were probably quite hard done by in making the 10 worst defensive ratings list. A closer look at their numbers revealed they were fairly similar to other teams in 2021, in all relavant defensive stats. As we’ll see below, in 2021 all the teams had very similar defensive ratings, except the Giants (rating of 68). Similar to offensive rating, the super shot added around 3% extra goals across the season, with similar goal attempts. This is a likely reason why these teams made the worst defensive rating list.
The good years, and the bad
Figure 1 shows the distribution of defensive ratings in each season, and how they compare to other seasons. The black dots represent each teams defensive rating for the season, and the red dots represent the average rating for all teams in that season. The top and bottom 10 defensive ratings in the tables above are labelled.
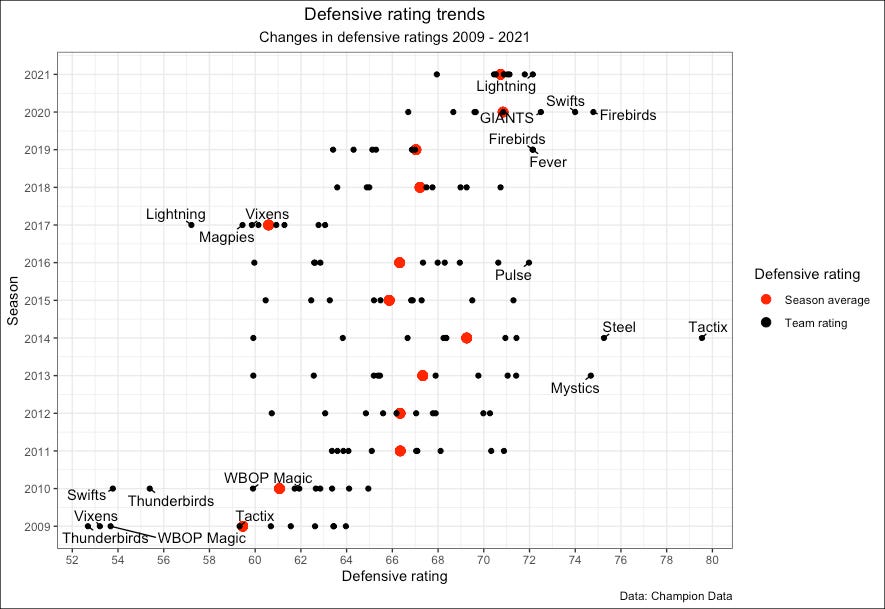
The 2009 and 2010 seasons had some clear defensive standouts, whose defensive ratings were much lower than the majority of teams in all years. The best 5 defensive ratings were in these years.
2012-2014 were characterised by the largest variance in team defensive rating across the season. The worst were really bad, and the best were… ok. The 2014 Tactix had the worst defensive rating and were a long way from the season average.
2017 contained several of the best defensive ratings, but all teams in that year were significantly lower than the years before or after. The variance in defensive rating of the teams in 2017 was particularly small.
The 2021 season had the lowest variance in defensive rating, with 7 out of 8 teams being within 2 goals against per possession. The Giants stood on their own with a significantly lower defensive rating on 68. As is shown, the Lightning barely made the worst 10 defensive ratings.
Admittedly, had I written about defensive ratings first, I probably would have only presented the top and bottom 5 ratings for both. The next 5 ratings were probably border-line outstanding (good and bad). Jhaniele Fowler being associated with 5 out 6 best offensive ratings drove my decision to present 10 in the previous post.
Are these defences comparable?
These results present a chicken and egg problem, or to be more technical, a direction of causality problem. If all the lowest (best) defensive ratings are teams in 2009, 2010 and 2017, does that mean that the defensive players were better in those years, compared to offensive players? Or have there been rule changes or rule interpretation changes, or statistical interpretation/measuring changes in those years, that meant that those years were anomalies? Are the best defensive players/combinations in the early years really that much better than those in the later years? What is causing the low defensive and offensive ratings?
Personally, 2017 appears to me a year for rebuilding and readjusting from the separation with New Zealand teams and players. There was significant upheaval of players and teams, which could explain the drop in overall performance.
The 2009 and 2010 seasons are a bit of an unknown outlier. They were played at a higher pace, 8-10 more possessions per game, compared to the subsequent seasons, but a similar pace to 2013 - 2016 seasons. Nothing stands out as a reason for the abnormally high turnover rates, and therefore low defensive ratings. Maybe someone else has a theory? I’d be all ears.
One way to judge is to look at the calibre of the players that show up in the list. The 2009 Thunderbirds and Vixens and WBOP Magic were stacked with defensive talent. von Bertouch, Gerrard, Mentor, Corletto, Chatfield, Hallinan, Langman, Kopua and de Bruin. These are the names in the top 3 teams but read like an all-star team. It’s hard, probably impossible to compare players between longer than consecutive seasons…. They were bloody good back in 2009 though…
Now we have both ends of the court, the next step is to combine the two. Next up is “net” rating.
The whole table