Net rating
Netball gets the NBA metric treatment part 4
Now comes the time to bring it all together. Net rating, as the name suggests, combines the offensive and defensive ratings of a team. The calculation being:
Net rating = offensive rating - defensive ratingIt gives the net differential between goals scored per possession and goals against per opponent’s possession. It essentially says; over the course of the season, for every 100 possessions (for and against) on average what was the overall difference in goals scored.
Net rating is a good measure because it:
Is pace adjusted - it doesn’t matter if you shoot 40 goals a game or 70 goals a game, performance is judged per possession. If a team, like the Fever, plays at a higher pace and scores more goals, they are not necessarily penalised for having a higher number of goals scored against them for simply having more possessions per game. They’re judged by how effectively they used their possessions vs. their opponents.
Accounts for in-season effects, like the super shot - additional goals scored by teams in a given season should be accounted for when taking the difference between the offensive and defensive rating.
Is strongly correlated with win percentage - more on this below.
Net best
The table below shows the teams that had the highest net ratings between 2009 and 2021, with data courtesy of Champion Data.
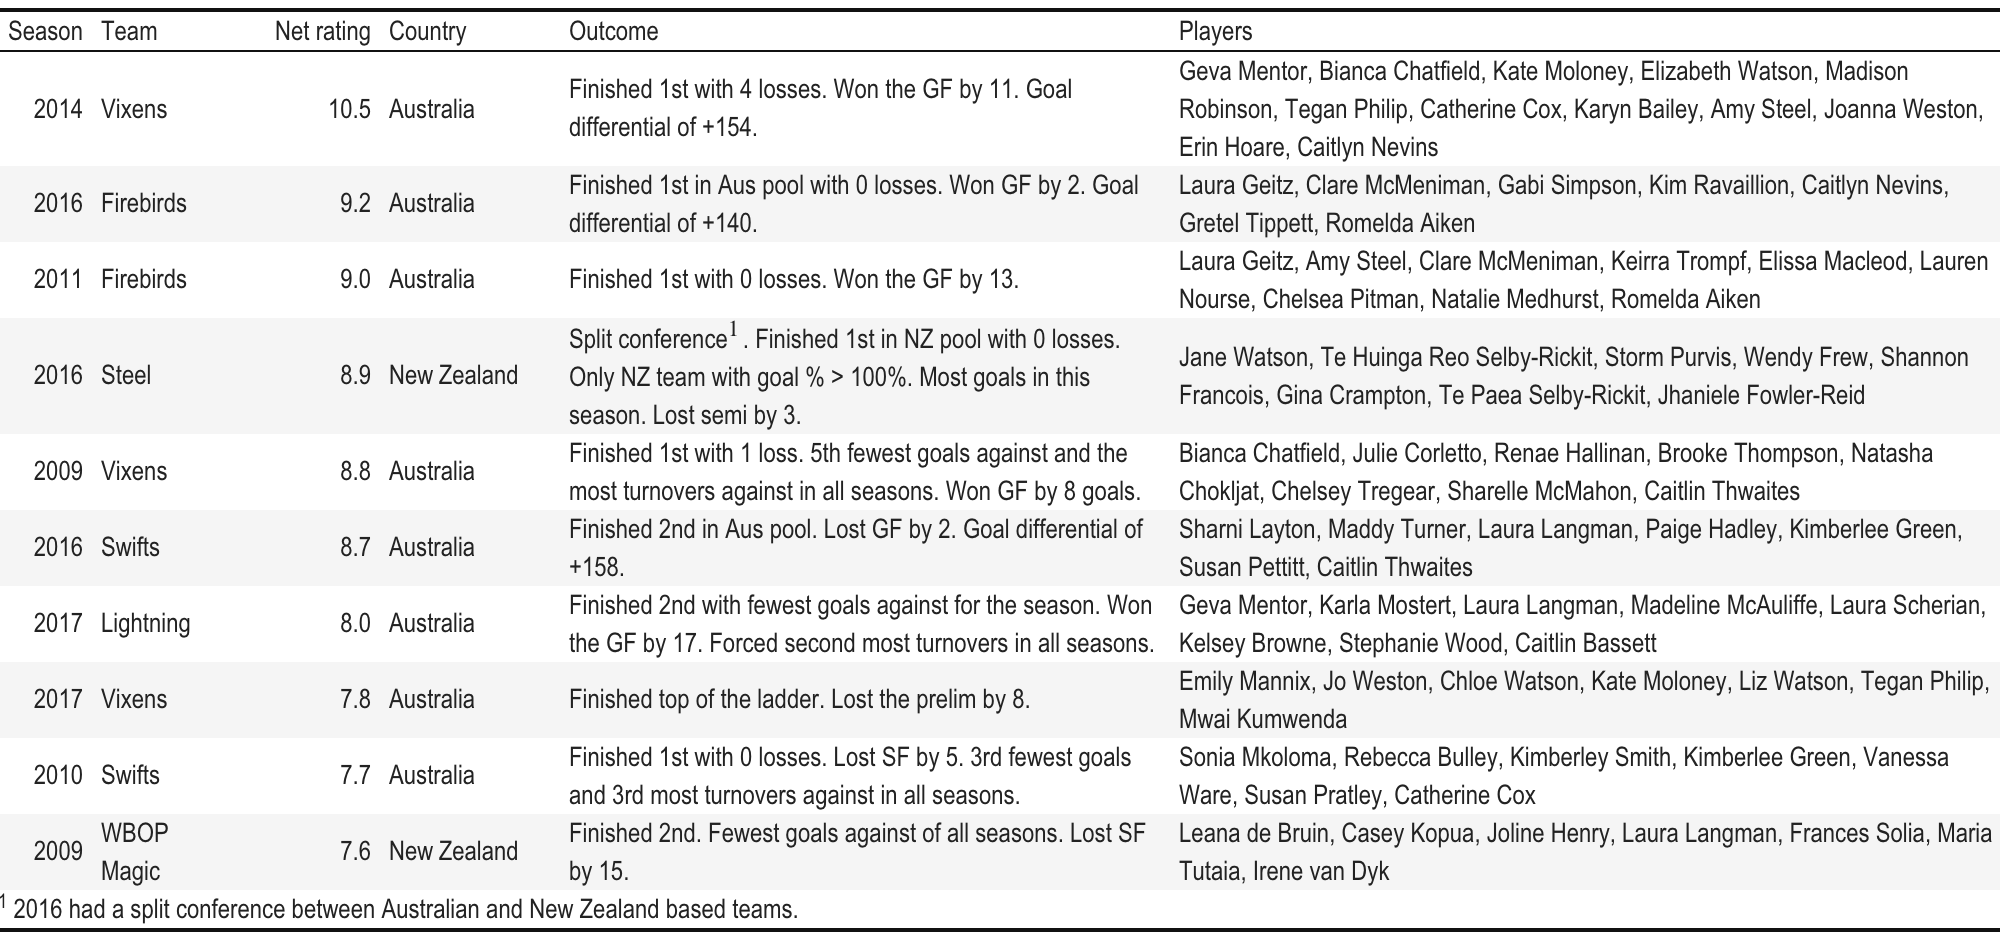
Each of the teams shown in table 1 finished first or second on the ladder at the end of the regular season. The teams that finished second in this list came behind teams also featured in the top 10 rated teams. It’s unsurprising that 8 of the 10 teams with the best net rating are Australian based. Australian teams featured far more often in the top 10 best offensive and defensive rated teams.
Net rating overview
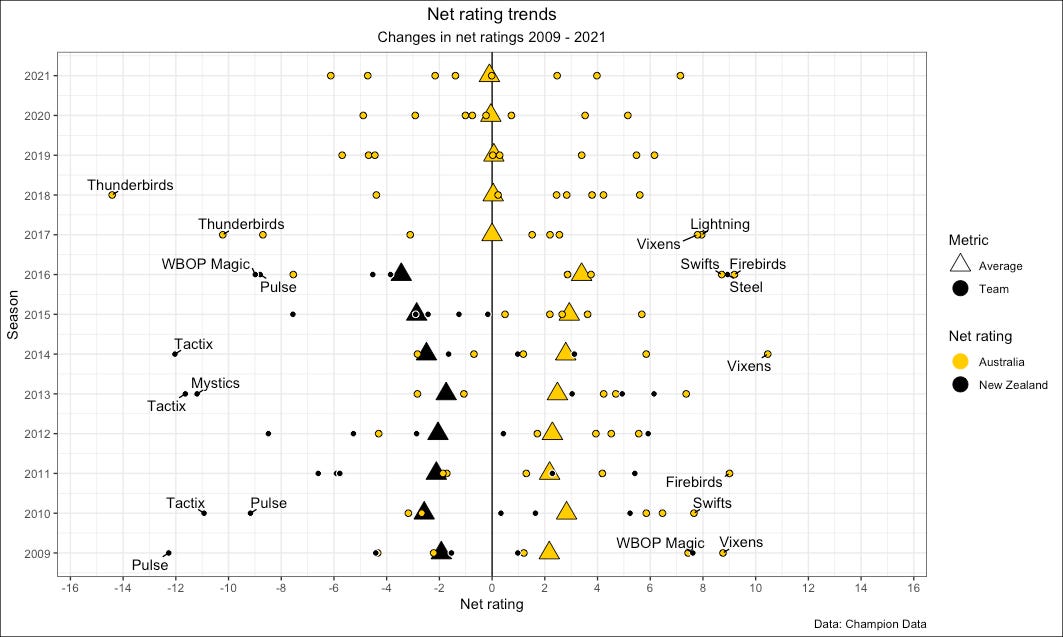
Figure 1 shows the distribution of net rating of all teams from 2009 to 2021. The circles represent a team’s net rating for the season from their country of origin, Australia (gold) and New Zealand (black). The larger triangles represent the average net rating of all teams from their country of origin in a given season. The top and bottom 10 net ratings in the tables above are labelled.
Standouts
For most seasons, particularly earlier than 2019, the lowest net rating is often a lot further from zero (the average for all teams) than the highest net rating is above it. In other words, most seasons had one or two exceptionally poor teams, more so than one or two exceptionally good teams.
The 2014 Vixens had the best net rating of all teams and finished the season with a record of 9 wins, 4 losses. Their wins were emphatic, by an average of 18 goals. Their biggest win came in round 8 against the Thunderbirds 64 - 26. Their largest loss was to the WBOP Magic in round 44-49. So their wins were big, and the losses were small, which lead to their strong net rating. They won the grand final that year against the Firebirds 53 - 42. The vast majority of their players also played at an international level at some point in their career.
The 2018 Thunderbirds had the lowest net rating, with -14.4. They lost all of their matches for the season, the only team to have a win-less season in all the seasons analysed.
NZ vs. Aus
Net rating might give some insight into the relative competitiveness of the New Zealand based teams vs. the Australian based teams. New Zealand teams had an average net rating of around -4 to -6 goals per 100 less than Australian teams for the entirety of the ANZ Championship. The gap between New Zealand and Australian teams widened toward the end of ANZ Championship, from 2013-2016. The biggest difference of around 7 goals per 100 was in 2016, and this was despite the strong season by the Steel (NZ) and a poor one from the Thunderbirds (Aus).
Since the separation of the leagues in 2017, the variance in net rating between all teams in the SSN has been lower. Aside from the Thunderbirds being particularly woeful in 2017 and 2018, Suncorp Super Netball has been a more close-run competition than the ANZ Championship. The largest variance in net rating was in 2016, and the lowest was in 2020. The variance in league net rating has been tracking down since 2016, which in my opinion is a good thing.
Best of the best
Did the teams best net ratings have both the best offensive and defensive ratings? Figure 2 shows all the teams that made one or more of the top 10 offensive, defensive or net rating. A black box indicates that the team made the top 10 for category on the x-axis, with the rank noted in the box. For example, the 2017 Lightning made the top 10 defensive rating in 6th, and net rating in 7th, and weren’t in the top 10 offensive ratings.
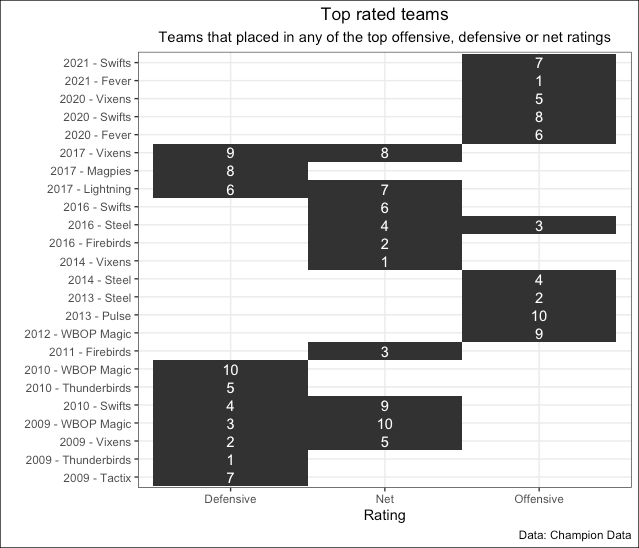
Figure 2 shows the prevalence of good defensive ratings in 2009, 2010, 2017, and good offensive ratings in 2020 and 2021. The top net ratings occurred somewhere in the middle. No team spanned all three top 10’s. The 2016 Steel was the only team to span the top 10 offensive and net rated teams. 5 teams made both the top 10 defensive and net rated teams.
Correlation with win percentage
How does net rating fare in predicting win percentage? Net rating is strongly correlated with win-percentage. Which is not surprising, with opposing teams getting approximately the same number of possessions per game, net rating is not far from showing which team often scored more goals than their opposition. But because offensive and defensive ratings are an aggregate from over the season there is room for teams to have high net ratings and still have a moderate win percentage (and vice-versa). If team’s wins are blow outs but losses are close games, they can potentially have a lower win percentage than their net rating would suggest.
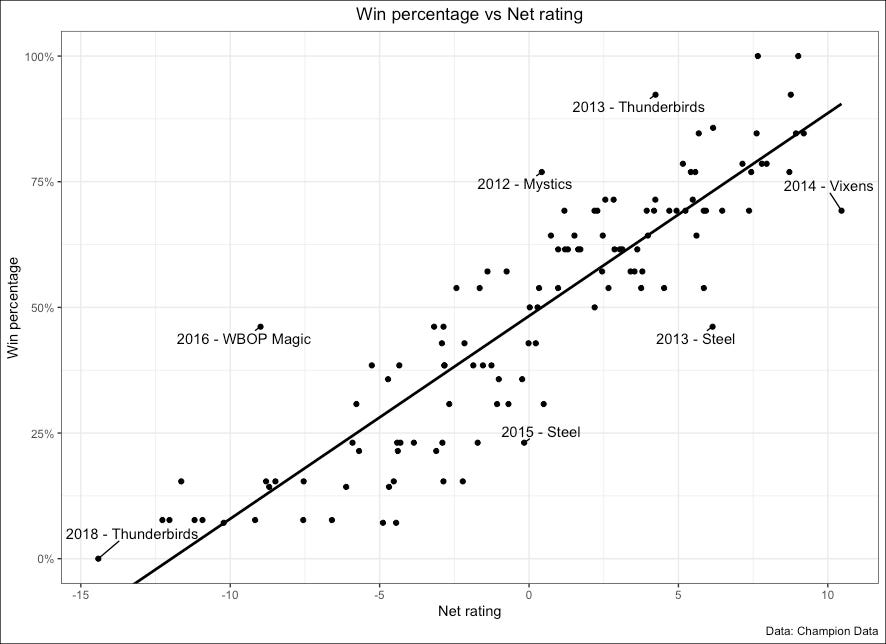
The 2014 Vixens had the best net rating, but managed to win < 75% of their games. The 2012 Mystics had a net rating of just above zero by managed to win just over 75% in the regular season. As was discussed earlier, net rating can be boosted by blow-out wins and close losses. What could also be said is, given the Vixen’s rating, they were unlucky not to win more games.
Final thoughts
Offensive, defensive and net ratings are a good way to compare teams who play different styles. Fast paced, strong defence/poor offence, a mix of both - all get brought onto somewhat of a level playing field. I do think it’s difficult to make definitive comparisons about teams from different seasons (especially with significant rule changes). You only have to look at the tiresome debate in the NBA on who is the G.O.A.T. Lebron or MJ? Comparisons between the players in different eras is difficult, nearing on pointless.
Offensive and defensive ratings offer a succinct way of summarising a teams performance that are relative or normalised. If I were to describe how a team performed over a given quarter or game, these ratings would be my first port of call. They tell you;
Pace, which can be compared to opposing team’s averages to see who is dictating it, or whether it’s is higher/lower than a normal game,
Possession outcomes - how a team is using their possessions. Are turnovers under or over represented as part of possessions, is the team shooting better or worse than the norm,
Game day performance - Is a teams offence or defence better or worse than normal, after accounting for variability.
My ideas for my next couple of posts are away from this subject, but I’d like to come back to net rating in future and apply it game-by-game to the 2020 season. The Fever and Vixens were both great teams but appeared to play the game in very different styles. Could be interesting.
Thanks for reading. MJ is the G.O.A.T. No question.
All net ratings