The possession game
The NBA uses some relatively simple statistics to measure the effectiveness of team and player offence and defence. This post will look at applying some of the base level statistics to netball, making adaptions where the games and their statistics may differ. The first, and very foundational statistic to discuss is possessions.
Team Possessions
Possessions for the sake of some useful performance metrics are essentially the number of opportunities a team has to score. Possessions count the entire set of outcomes for a team’s attempts to score in a given phase of play. A possession stat in basketball is counted when possession is transferred from one team to the other. Netball doesn’t quite fit this mould, which I’ll get to soon.
A possession can end with;
a goal,
a turnover, or,
a missed goal that is rebounded by the opposing team or goes out of bounds.
A possession can be extended by the offensive team rebounding a missed shot. The simplest way of counting possessions in the NBA is:
possessions = (shot attempts - offensive rebounds) + turnoversOffensive rebounds are subtracted from attempts, which accounts for the extension of a possession with an offensive rebound. I’ll sometimes describe shot attempts minus offensive rebounds as “effective attempts”. All of these simple statistics are counted by Champion Data, and have been from 2009, which means we can look at possession (or pace) behaviour over the last 12 seasons.
Netball differs in the event of a made goal because the ball is not necessarily given to the defending side, it is given to the team that didn’t have the last centre pass. This might seem like a minor difference, but this fact means that unlike basketball, the number of possessions each team gets is not necessarily even. Teams that score on their opponent’s centre pass get an additional possession. That is another chance to score or make a mistake (turnover, missed shot without rebound).
In similar sports like basketball and korfball, after every score, possession is given to the team that were just scored on, meaning possessions are always approximately even (some events aren’t counted, like end of quarters and some foul shots in basketball which can cause the inequality).
Pace
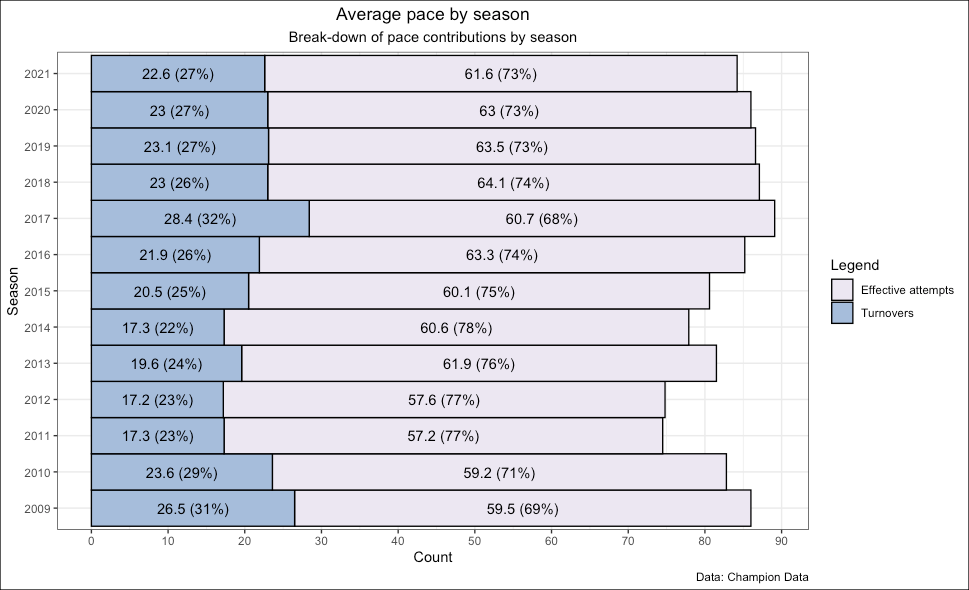
The only new game statistic I’ll introduce here is pace, or possessions per game. Figure 1 shows the average possession per game of all teams during a given season.

There have been ebbs and flows in league-wide pace over the 12 seasons shown above. What’s interesting is, aside from 2013 and 2017, the change in pace tends to follow year-on-year trends. From 2009 - 2011 pace decreased, then from 2011 - 2017/2018 it increased. Since then it has decreased. This would suggest there is some temporal (time) correlation/connection between pace in consecutive years. This might be reflective of progressive changes in game tactics across the league or could just be some sort of coincidence. What surprised me was the change in substitution rule before the 2020 season didn’t result in an increase in pace. Teams can and did increase the number of subs per game, dramatically.
The first year of SSN, 2017, saw a significant increase in the number of turnovers per game. Whether it was the reshuffle of players, the introduction of new talent to newly formed teams, I’m not sure what drove the increase. The increase in turnovers also offset the effective shot attempts in 2017 too. The proportion of attempts that make up total possessions decreased by 6% to 68%, the lowest in all years analysed.
Team Pace
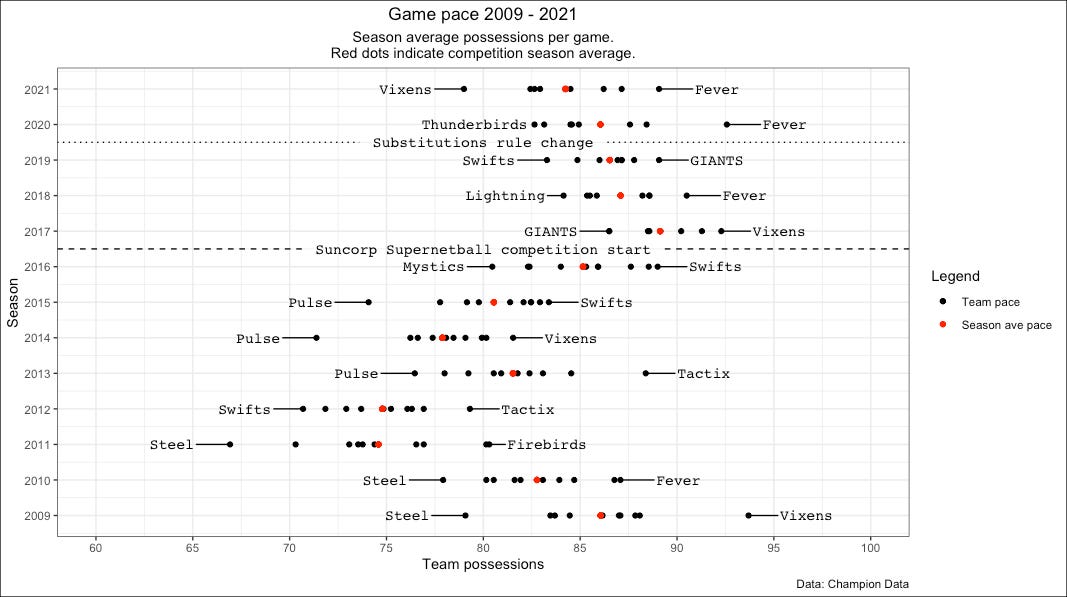
Figure 2 shows the pace of individual teams in a given season (black dots), with the season average indicated by red points. This figure shows the seasons where teams played at a similar pace (2018) and seasons where the was a significant difference (2011). It also shows where certain teams were outliers, operating in a much different style to other teams, for better or worse.

The figure shows that teams have had success with both high and low-paced seasons. There’s a raft of successful teams either end of the scale over the years - the 2019 Swifts, 2018 Lightning had the lowest pace, while the 2014 Vixens and 2011 Firebirds the highest, all winning the premiership. The Fever have also been very successful in recent years, and have had some of the highest paced seasons of the past 12 years.
On the other side of the coin, the 2013 Tactix had the 4th highest average pace between 2009 and 2021, but finished 9th on the ladder. Their higher pace is likely reflective of how easy they were to score on. The 2015 Pulse had the lowest pace in that year finished 2nd last on points.
So pace isn’t really an indicator of success or failure in it’s own right. Both scoring quickly and being scored on quickly lead to a large number of possessions. And of course the inverse is true. What pace allows you to do is to see how effective teams are with the possessions they have. Which is what comes next…
What’s next?
Possessions are the foundation of producing some effective offensive and defensive performance measures. Over the next few posts I’ll be showing rankings of the best offensive and defensive performers, as judged by these performance measures. It will be interesting to see if people agree or disagree with these rankings, and whether these metrics will be a good statistic to follow in future.


